Dashboards
Dashboards
Dashboards are a way for EH&S users to track, monitor and manager their most critical information. The dashboard is an intercactive, visual display that give our clients the ability to quickly and easily determine and address areas of concern.
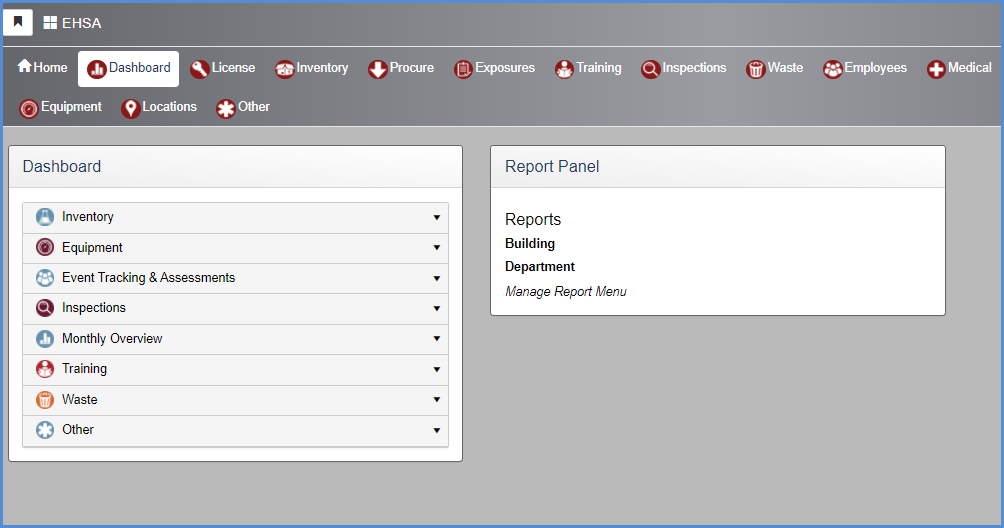
Click the down arrow to the right of one of the Dashboard Categories to view the topics for each.
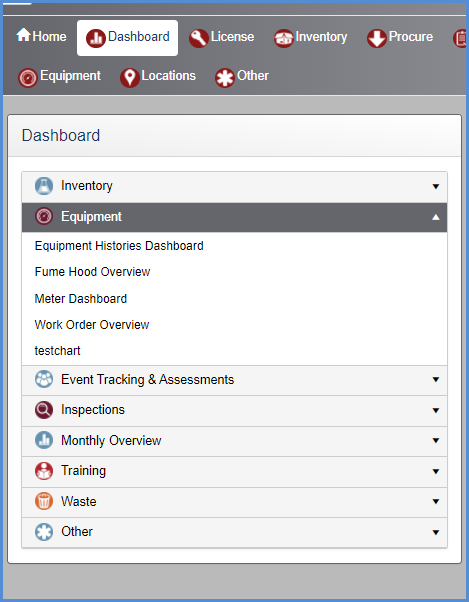
- For example, the Meter Dashboard prompts the user to enter setting before clicking [Apply] to view results.
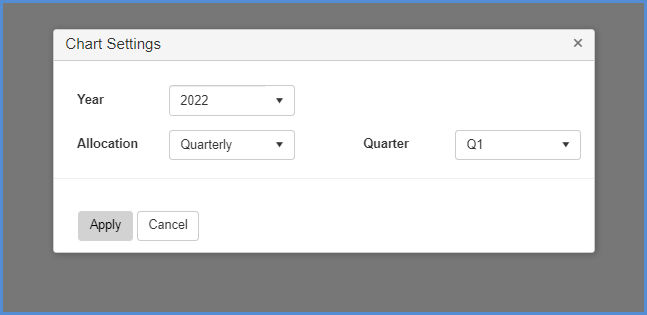
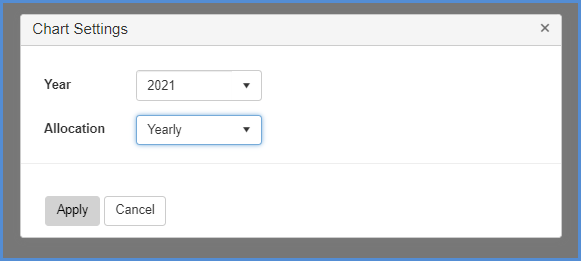
- Here is example of settings for the Year 2021.
- The results are displayed below.
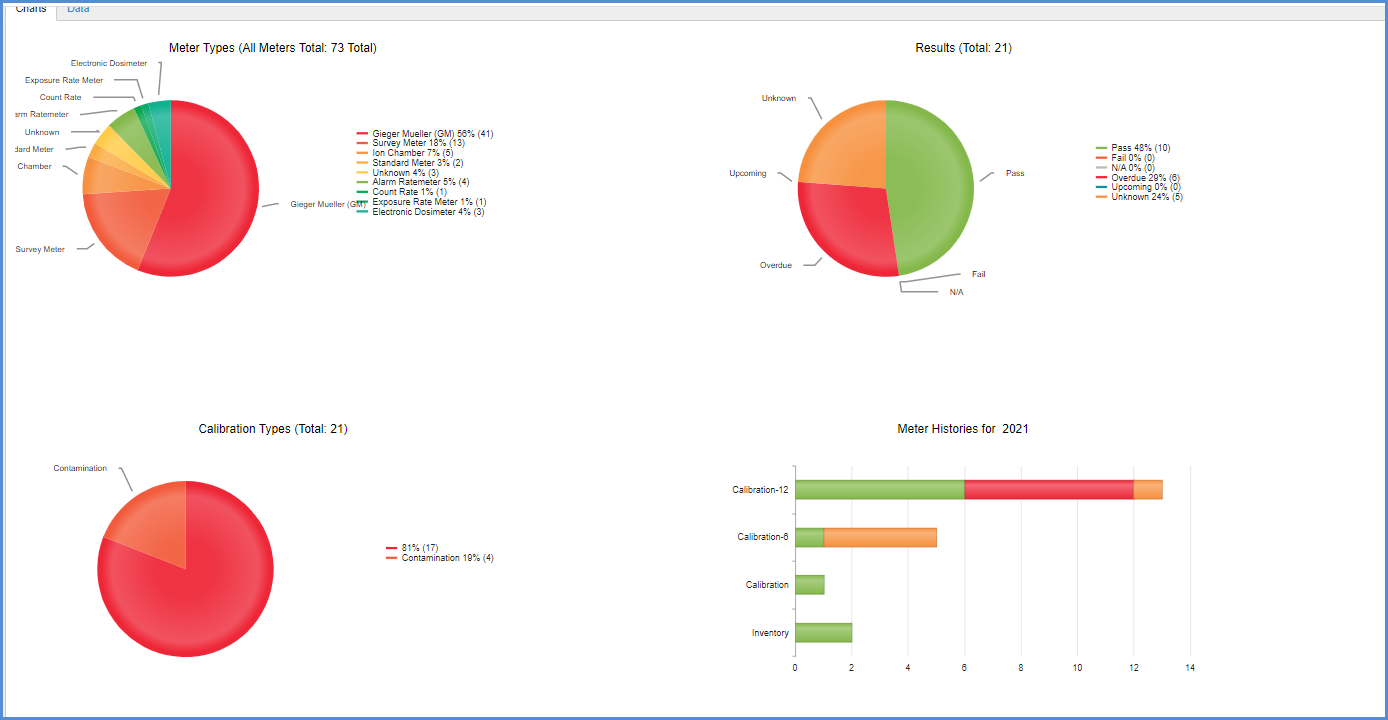
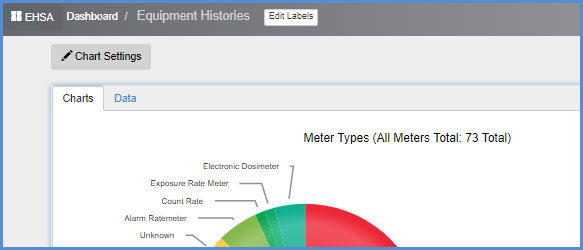
- Users can toggle between the Charts and Data tabs.
- Clicking the Data tab will show the data in grid views.
- The data can be sorted or filtered as in EHSA list views thoughtout the applicaiton.
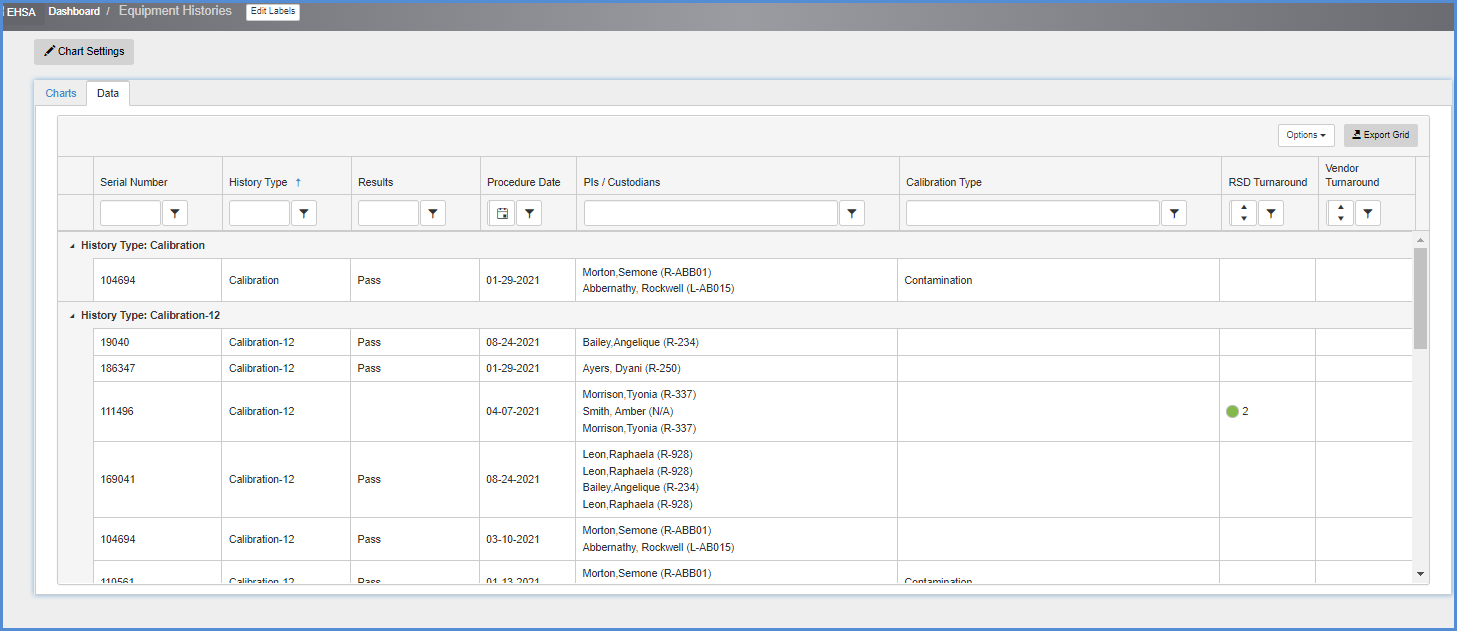
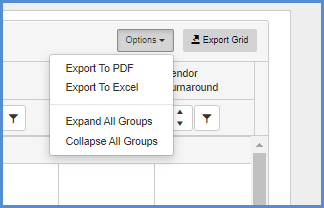
- Users can also export the data on screen.
- Click the Chart Settings button to go back and enter different date criteria for viewing.